


Make spark jobs readable again!
A simple labeling trick to end cryptic Spark job names and ease debugging.

Your go to resource for actionable insights into big data performance. Each week, we’ll share tips, tools, and techniques to help you optimize your workflows. If you’re dealing with large datasets, distributed systems, and are tired of fluff, this newsletter is for you!
The Power of Apache Spark
Apache Spark is the most widely used engine for big data processing and analytics. It’s designed for speed, scalability, and handling massive datasets—think 100GB of data or more (more on that in future posts).
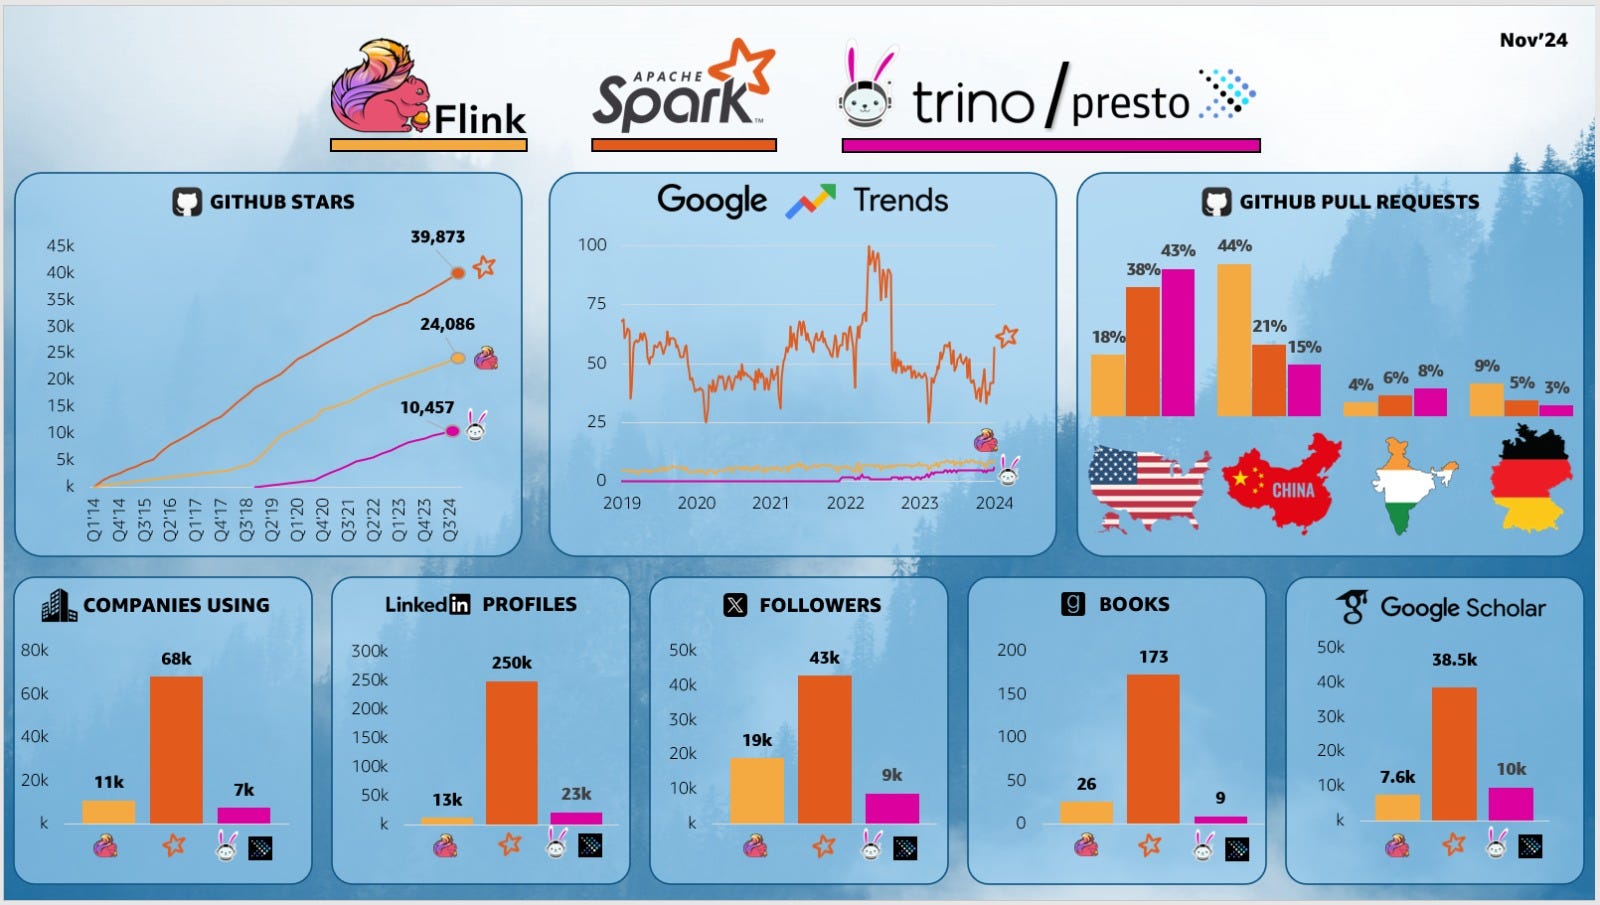
Recent statistics gathered by Yonatan Dolan show how Spark dominates the big data landscape. So don’t be surprised if many of our posts focus on Spark.
To use Spark effectively, you need to be familiar with several core abstractions, including:
Applications
Queries
Jobs
Stages
Tasks
Clusters
Understanding these components is crucial for debugging, optimizing performance, and staying productive when building data pipelines.
Each week, we’ll cover different aspects of big data performance and share useful performance tips. In this post, we’ll focus on one of Spark’s most foundational concepts: the Spark application.
What Is a Spark Application?
A Spark application is the primary unit of work in Spark. When you run your code, whether in PySpark or Scala it creates a Spark session, which in turn creates a Spark application to process data across the cluster. Each query in your application’s code triggers a job, which is defined by one or more actions (we’ll explore these in future posts, so don’t worry if you’re not yet familiar with those concepts).
Understanding the structure of your Spark application is essential for:
Debugging performance bottlenecks
Optimizing resource usage
Improving productivity in day-to-day development
Basic ETL as an Example:
Here’s a simple PySpark script to illustrate the concept. I wanted to load sales data, filter for items that occur more than once, and then save the results partitioned by quantity. I named my app “Sales Filterer.”
from pyspark.sql import SparkSession
import os

spark = SparkSession \
    .builder \
    .appName("Sales Filterer") \
    .master("local[1]") \
    .getOrCreate()


df = spark.read.load(os.getenv('SALES_FILES_LOCATION'))
df_filtered = df.filter(df.ss_quantity > 1)


df_filtered.write \
    .mode("overwrite") \
    .partitionBy("ss_quantity") \
    .parquet("/tmp/store_sales")

spark.stop()
When I run this code, it takes a long time to finish, and I’m not sure why. That’s where Spark Web UI comes in.
Your best friend, The Role of the Spark Web UI
The Spark Web UI is your best friend for monitoring and debugging. It runs on the driver, providing real time insights into execution. With it, you can:
Identify bottlenecks in queries in real time
Optimize performance by analyzing execution metrics
Review historical runs on the Spark History Server
Unfortunately, the UI isn’t the most user friendly tool, and understanding what’s going on can feel like part art and part science. We can’t cover everything in one post, but let’s tackle one simple tip that helps a lot.
The Problem with Default Query Names
Even though I named my app, if we check the Spark Web UI, you’ll still see something like:
parquet at NativeMethodAccessorImpl.java:0What does that even mean?
By default Spark uses internal method names in job labels when no custom descriptions are provided. It can appear as though Spark is referencing arbitrary Java or JVM method names.
This is confusing, especially if you’re running multiple applications with multiple jobs. It can quickly become a mess.
Productivity Tip: label your jobs!
In our example, add a descriptive label to your PySpark code before the action that writes to Parquet:
spark.setJobDescription("Writing Filtered Sales Data Baby")

df_filtered.write \
    .mode("overwrite") \
    .partitionBy("ss_quantity") \
    .parquet("/tmp/store_sales")
Check out the GIF below of the spark web UI to see how these default names compare to our descriptive label:
Advanced Tip: Group jobs together!
This feature is especially useful when you have multiple processing stages that are logically connected—such as ELT workflows, multi-step transformations, optimizations, or maintenance jobs and you want to track and monitor these stages as a cohesive unit.
By default, all Spark operations run in the same notebook cell or job submission are treated as part of a single job group. However, the setJobGroup() method allows you to explicitly define group IDs and descriptions, making it easier to organize, track, and visualize related jobs and operations in the Spark UI.
Check out this blog post for more in-depth overview:
https://milescole.dev/data-engineering/2024/09/13/Mastering-Spark-Enhancing-Job-Visibility.html
Why Labeling Matters
By adding descriptive labels, you’ll immediately see more intuitive names in the Spark UI, this will help you with:
Saves hours of frustration during debugging.
Facilitates teamwork by providing clear indicators of what each job does.
Helps optimize performance by quickly identifying slow or inefficient queries.
And the best part? It works seamlessly in both open-source Apache Spark and managed platforms like Databricks.
Recommended read of the week:
If you’re interested in database performance, Andy Pavlo is a well-known figure in the database world. He teaches excellent CMU courses on YouTube and cofounded Ottertune, a startups for optimizing database performance that was closed last year. Check out his 2024 retrospective for more insights:
2024 Databases Retrospective
Conclusion and Call-to-Action
Thanks for reading the first edition of Big Data Performance Weekly! If you found this post helpful, consider subscribing for more in-depth guides, practical tips, and insights delivered to your inbox every week.
Let’s keep optimizing our big data systems together—click Subscribe now to never miss an update.
And don’t forget to drop your questions or comments below!