
Understanding Apache Spark's Execution Hierarchy: From Applications to Tasks
Learn how the Apache Spark execution model works from Applications to Jobs, Stages, and Tasks. To optimize performance and debug your big data applications effectively.

When working with Apache Spark at scale, understanding its execution model isn't just academic—it's essential for effective performance tuning, resource allocation, and debugging.
Many data engineers focus solely on writing their code without grasping how Spark actually breaks down and executes their code across a distributed computing environment.
Let's unpack Spark's hierarchical execution structure to see how your data processing job flows from a high-level application down to individual CPU cores.

The Apache Spark Execution Hierarchy Explained
Spark's execution model follows a clear hierarchy, breaking large distributed computations into progressively smaller units that optimize parallel processing:
Application: The Entry Point to Spark Processing
At the top level sits your Spark Application—simply put, this is your Python script, Scala program, or notebook that you're running.
In production environments, this might be an Airflow task calling a PySpark script. The Spark Application is the container for everything else that happens in the Spark architecture.
A single Spark Application can generate multiple Spark Jobs depending on how many actions you call in your code.
Jobs: Action-Triggered Execution Plans
The next level down is the Spark Job. Each action you trigger in Spark (like count(), collect(), write.parquet(), etc.) creates a separate Spark Job.
This is a crucial point that many developers miss: transformations like map() or filter() Don't actually execute until you call an action. When you do, Spark creates a Job represented internally as a Directed Acyclic Graph (DAG)—essentially a blueprint for execution that Spark's DAG Scheduler uses to plan the computation.
Spark Jobs are the level where Spark starts planning how to break your computation into parallel work across the cluster.
For more info, check out my in-depth post on actions vs transformations.
Stages: Shuffle Boundaries in the Execution Plan
Each Spark Job is further divided into Spark Stages. The boundaries between Stages are determined by shuffle operations—those points in your computation where data needs to be redistributed across the cluster.
Shuffles occur during wide transformations such as groupByKey(), reduceByKey(), join(), repartition(), etc. These operations require moving data between executors, which is expensive and creates natural boundaries in the execution flow.
Understanding Spark Stage boundaries is critical for performance optimization, as shuffles are typically the most resource-intensive operations in Spark processing.
For more info, check out my in-depth post on shuffle.
Tasks: The Core Work Units of Spark Processing
At the lowest level of the hierarchy are Spark Tasks—the actual units of work that get assigned to individual cores on your executor nodes. Here's what you need to know about Spark Tasks:
Each Spark Task processes exactly one partition of your data
The formula is simple: 1 partition = 1 task
Tasks map roughly to available slots, which typically correspond to CPU cores
All Tasks within a Stage perform the exact same operation (filtering, sorting, etc.), just on different partitions of your data
This is where the rubber meets the road in Spark (you get a spark?)—individual Tasks running on individual cores, processing chunks of your data in parallel to achieve distributed processing efficiency.
Performance Implications for Spark Optimization
This execution hierarchy directly impacts Spark performance in several ways:
Jobs: Multiple actions in your code create multiple Spark Jobs, potentially causing redundant computation if you're not caching appropriately. Minimizing unnecessary actions can reduce overall computation and improve Spark performance.
Stages: Each Stage boundary represents a shuffle, which typically involves disk I/O and network transfer. Reducing the number of shuffles (or optimizing them) can dramatically improve Spark performance at scale.
Tasks: The number of Spark Tasks (determined by your partitioning strategy) directly affects parallelism. Too few partitions underutilize your cluster; too many create excessive overhead. Ideally, you want 2-3 Tasks per CPU core in your Spark cluster for optimal resource utilization.
Partition Sizing: Since 1 partition = 1 task, your partition sizing directly affects task runtime. Extremely skewed partitions will cause tasks that slow down the entire Stage, creating Spark performance bottlenecks.
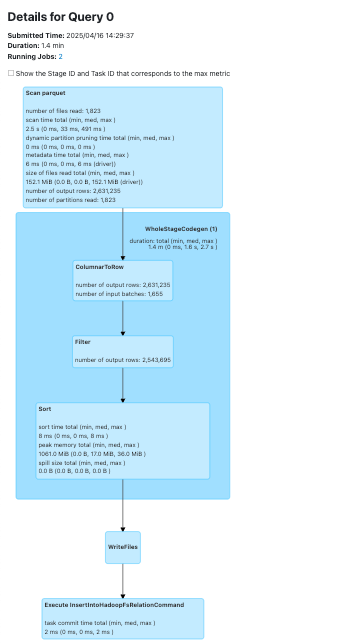
Connecting it all in the Spark Web UI
The Spark Web UI is your window into the execution hierarchy we've discussed throughout this post. It provides a visual representation of your Spark application's inner workings, allowing you to see exactly how your code is being executed across the cluster.
Navigating the Spark Web UI Tabs
When you open the Spark Web UI (typically on port 4040 of your driver node), you'll find several tabs that directly map to the execution hierarchy:
Jobs Tab: Shows all the Spark Jobs triggered by your application's actions. Each job entry displays its execution time, status, and the number of stages it contains.
Stages Tab: Provides detailed information about each stage within your jobs, including shuffle read/write metrics, task distribution, and potential skew issues.
Storage Tab: Shows which DataFrames or RDDs you've cached and how much memory/disk space they're using.
Executors Tab: Displays information about the executor nodes in your cluster, including resource usage and task metrics.
SQL/DataFrame Tab: Perhaps the most powerful tab for optimization, showing the logical and physical plans for your DataFrame operations, including predicate pushdowns and other optimizations performed by the Catalyst optimizer.

Correlating UI Data with Execution Hierarchy
The beauty of understanding Spark's execution model is that the Web UI suddenly becomes much more readable:
You can trace a slow job by first identifying which stages within it are consuming the most time.
Within problematic stages, you can investigate task distributions to identify partition skew.
The SQL tab shows you exactly how your DataFrame operations have been translated into execution plans with stages and shuffles.
Advanced Monitoring Beyond the Native UI
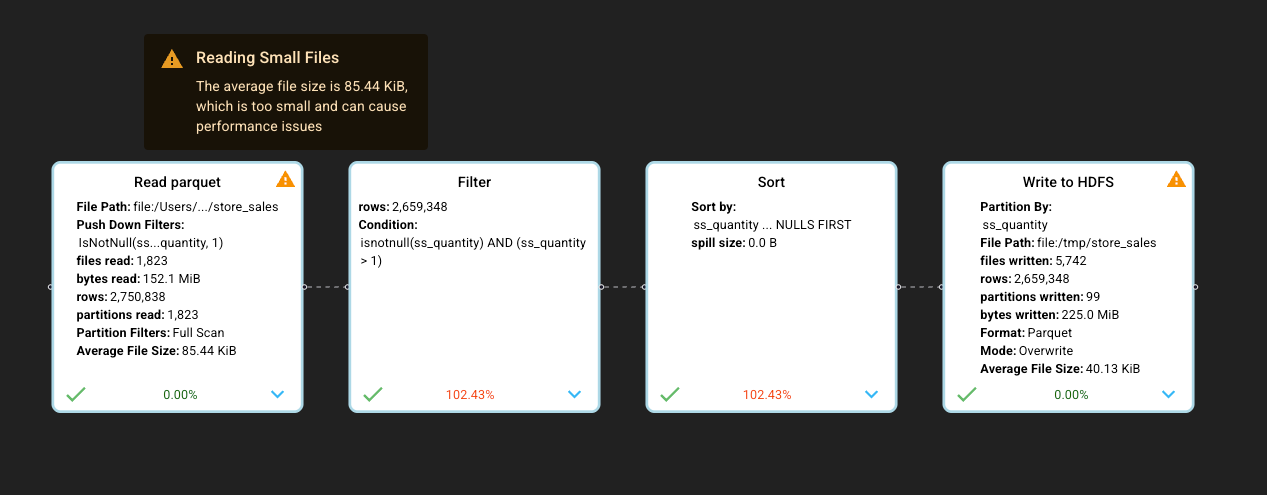
Unfortunately, mastering the Spark Web UI is more of an art form than science. The native interface, while powerful, can be difficult to interpret and doesn't always provide clear guidance on performance improvements.
This is why I recommend using Dataflint, an open-source project (I am one of the project contributors) that adds another tab with a modern UI to the Spark interface. In this enhanced interface, the query plan is not just more intuitive—you get actionable recommendations on improving performance rather than having to decipher raw metrics yourself
Conclusion: Leveraging Your Knowledge of Spark's Execution Model
Understanding Spark's execution hierarchy—from Applications down to individual Tasks—transforms how you approach development, debugging, and optimization of big data applications. This knowledge empowers you to:
Write more efficient code: Design your transformations with an awareness of how they'll translate into stages and tasks.
Debug more effectively: Quickly isolate performance issues to the appropriate level of the hierarchy instead of randomly tuning parameters.
Optimize resource allocation: Make informed decisions about executor configurations and partitioning strategies based on your workload characteristics.
Communicate more clearly: Discuss performance issues with your team using precise terminology that maps directly to Spark's actual execution model.
Rather than treating Spark as a black box that occasionally needs arbitrary configuration tweaks, you can approach optimization methodically by understanding the relationships between your code, the resulting execution plan, and the resources available in your cluster.
Whether you're processing gigabytes or petabytes of data, this foundation in Spark's execution model will serve you well as you build and scale data processing applications across your organization.
Great content, thanks! I started using DataFlint with Ganglia, and it seems very promising.